What does a topographic map show? It shows the land’s shape, height changes, water, routes, and the man-made features that affect movement on foot. For hiking and backpacking in the UK, that matters because a short line on paper can hide a steep climb, a boggy hollow, or a valley that gives you a better line of travel. In the sections below, I break down contour lines, symbols, scale, and the route-planning habits that make the map genuinely useful on the hill.
The essentials you need before reading any contour map
- Contours show relief, so they tell you where the climbs, descents, ridges, and valleys are.
- Symbols add the practical details: paths, water, buildings, access land, and hazards.
- Scale changes how much detail you see and how accurately you can judge distance.
- Grid references help you pinpoint a location instead of guessing from landmarks alone.
- A map is a planning tool, not a weather report or a guarantee that the ground is easy.
What the map actually shows beyond the route line
I like to think of a topographic map as a model of the ground, not just a drawing of roads. It shows the three-dimensional shape of the landscape on a flat surface, which is exactly why it is so useful for walkers, hillwalkers, and backpackers. You are not only looking for where to go; you are also trying to understand how the terrain will feel under your feet.
For a day hike in the UK, that can be the difference between an easy valley walk and a tiring ridge crossing. For an overnight trip, it becomes even more important because you need to think about water, shelter, escape routes, and where the ground will slow you down.
| What you see | What it tells you | Why it matters on the trail |
|---|---|---|
| Contours and shaded relief | Height, slope, hills, valleys, and ridges | Helps you judge effort and choose the easiest line |
| Water features | Rivers, streams, lakes, marshes, fords, reservoirs | Useful for refills, route breaks, and wet-ground warning signs |
| Vegetation and open ground | Woodland, rough grass, moorland, scrub, and clearings | Affects visibility, footing, shelter, and route comfort |
| Paths and access lines | Footpaths, tracks, rights of way, access land, roads | Shows where you can realistically and legally travel |
| Buildings and landmarks | Farms, huts, walls, bridges, car parks, churches | Helps you confirm position and plan stops or exits |
Once you stop reading the map as a flat route and start reading it as terrain, the rest of the symbols make far more sense. The next thing I usually look at is contour lines, because they tell you the real story of the climb.
Contour lines reveal height, slope and relief
Contour lines are the backbone of any topographic map. Each line joins points of equal height, so the pattern of the lines tells you how the land rises, falls, and bends. On detailed UK walking maps, such as Ordnance Survey Explorer sheets, the contour interval is typically shown at 5m and/or 10m, which is detailed enough to judge small changes in terrain as well as bigger hill sections.
Spacing tells you how hard the ground will feel
The rule is simple: close contour lines mean a steep slope, and wider spacing means gentler ground. That sounds basic, but it is one of the most useful things a hiker can learn. A hill that looks modest on a page can become draining if the lines bunch together for a long climb.
I pay special attention to the spaces between contour bands. If the lines are tightly packed for a long stretch, I expect a sustained climb or descent. If they open out, the ground usually becomes easier to move across. That matters when you are carrying a pack, because steep ground changes your pace far more than raw distance does.
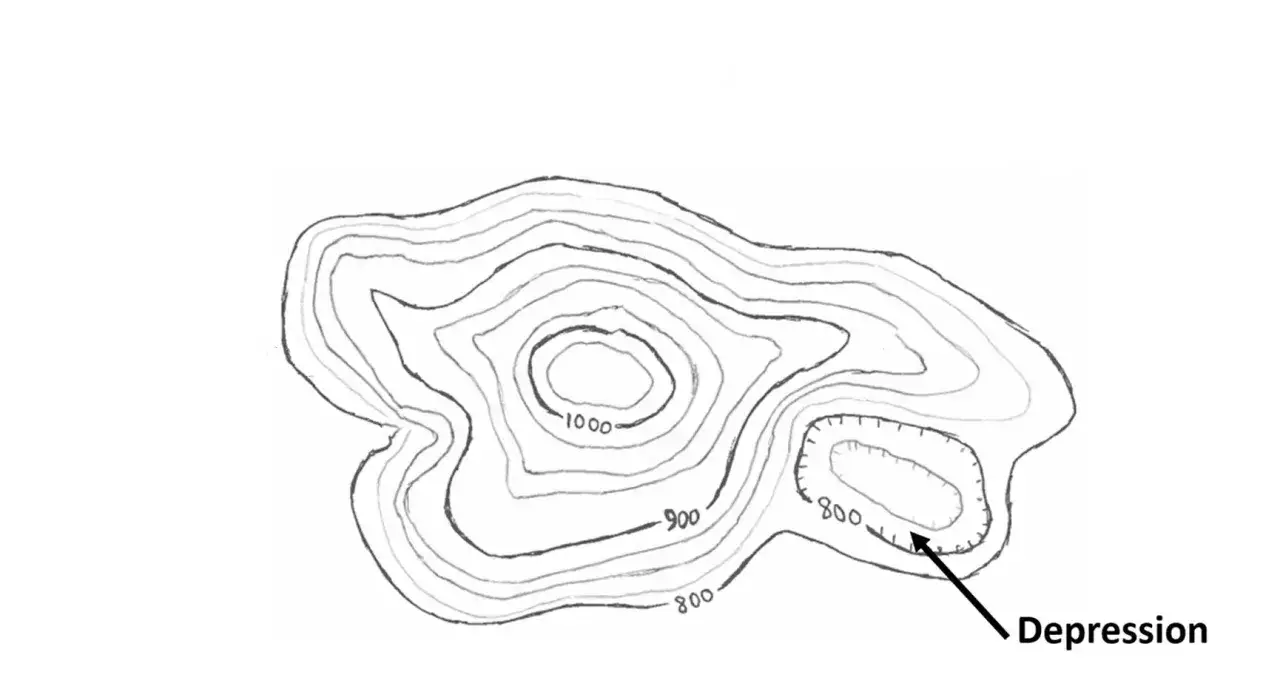
Shapes tell you whether you are looking at a hill, a valley, or a spur
Contour lines also reveal landforms. Closed loops usually show a hill or rise in the ground. A V-shape that points uphill usually marks a valley, while a V-shape that points downhill usually marks a spur. One small detail I always remember: contour numbering reads uphill, so the top of the number points toward higher ground.
That helps on mixed terrain, where valleys, ridges, and shoulders can blend together visually. If you are trying to cross a mountain area in poor weather, those shapes become more than map-reading trivia. They are the clues that tell you whether you are walking into a bowl, along a crest, or across a drainage line.
Read Also: Hiking in the Rain - Stay Dry & Safe on Wet Trails
Why the contour interval matters
The interval is the vertical gap between adjacent contour lines. A smaller interval gives you more detail, which is ideal for hiking maps because you can see subtle changes in relief. A larger interval gives you a broader picture, but you lose some precision. That trade-off is normal, and it is one reason why detailed mapping is so valuable when the route is steep or technical.
In practice, I use contour lines to answer one question before anything else: how will the ground shape the walk? Once that is clear, the symbol key becomes much easier to interpret.
Symbols turn the landscape into practical navigation clues
Contours explain the shape of the land, but symbols tell you what is actually on it. That includes footpaths, tracks, walls, fences, bridges, streams, woodland, farmland, campsites, and built-up features that help you navigate. On Ordnance Survey maps, the colours and line styles vary by series, so I never rely on memory alone. I check the legend because that is where the map’s real meaning lives.
| Symbol group | Common examples | Why it matters |
|---|---|---|
| Blue | Rivers, streams, lakes, reservoirs, marsh | Useful for water planning, but also a warning about wet or crossing-prone ground |
| Brown | Contours, earth features, cliffs, steep relief | Shows the physical difficulty of the route |
| Green | Woodland, scrub, rough grass, open access areas | Affects visibility, shelter, and how easy it is to move through the land |
| Black and red | Buildings, walls, roads, boundaries, names | Helps confirm position and identify man-made reference points |
| Route markings | Footpaths, bridleways, rights of way, long-distance trails | Shows where access is expected, though the ground may still be awkward |
For UK walkers, one detail is especially handy: on OS Explorer maps, public rights of way are shown in green, while on OS Landranger maps they are shown in magenta. That is useful, but I still treat the map key as mandatory reading because symbol styles can vary and not every path on the page feels the same on the ground.
Symbols are what turn a map from a terrain sketch into a route-planning tool. That leads straight to scale and grid references, because detail only helps if you understand how much ground the map is really covering.
Scale and grid references change how you plan the day
Scale tells you how much the real world has been reduced to fit on the page. In the UK, the two most common choices for outdoor walking are 1:25,000 and 1:50,000. They are both useful, but they solve different problems. I reach for 1:25,000 when I need detail and 1:50,000 when I want the bigger picture.
| Map type | Scale | Best for | Trade-off |
|---|---|---|---|
| OS Explorer | 1:25,000 | Walking, hiking, hill routes, footpaths, detailed terrain reading | Shows less area on each sheet |
| OS Landranger | 1:50,000 | Longer routes, broader planning, linking valleys and regions | Less fine detail on paths and small terrain changes |
If I am planning a backpacking trip across mixed terrain, I usually want the detail of Explorer sheets for the route itself and the wider context of Landranger-style mapping for the bigger picture. The point is not to pick one forever. It is to use the right level of zoom for the decision in front of you.
Grid references are the other half of that precision. A 4-figure grid reference identifies a 1km square, while a 6-figure grid reference narrows that down to a 100m square. That is the difference between saying “roughly here” and “this is the exact patch of ground we are on.” If I needed to share my location with someone, I would always prefer the 6-figure version.
For distance, scale matters just as much as location. A map can make a route look short and simple when the real effort comes from ascent, rough ground, and detours around wet or blocked sections. That is why scale is a planning tool, not just a technical detail in the corner of the sheet.
How I use a topographic map for hiking and backpacking in the UK
When I plan a route, I do not start by tracing the prettiest line. I start by asking what the terrain will demand from me. That is especially important in the UK, where a route in the Lake District, Snowdonia, the Pennines, or the Scottish Highlands can change character fast once the contours tighten up.
- Mark the start, finish, and bail-out points. I want at least one realistic way out if the weather turns or the group slows down.
- Read the contour pattern before the path line. If the terrain is steep, the line on the page may be the least important part of the decision.
- Check water, crossings, and wet ground. Streams, marsh symbols, and valley bottoms can change the whole feel of a route.
- Look for contour-friendly travel. Sometimes contouring around a slope is faster, safer, and less tiring than going straight up and down.
- Estimate time from both distance and height gain. Flat miles and hill miles are not the same thing, especially with a loaded pack.
- Confirm access and practical stops. Paths, rights of way, bridges, campsites, and transport links all matter on a longer trip.
That practical reading habit is what turns a map into something you can trust when the route gets awkward. It also helps avoid a few mistakes that catch out even experienced walkers.
The mistakes that cost time or energy on the trail
The most common mistake I see is reading the map too literally. A line across the paper is not the same thing as a pleasant line on the ground. Another frequent error is underestimating how much effort a steep contour pattern adds, especially when the route looks short in kilometres but climbs hard in reality.
- Assuming every path on the map is obvious, fast, or well maintained.
- Ignoring contour spacing and then being surprised by a long climb or descent.
- Forgetting that a 1:50,000 map gives a broader view but less detail than a 1:25,000 map.
- Trusting a water feature without checking whether it is crossable or dry in the season you are walking.
- Using the map as if it shows weather, mud depth, ice, or fallen trees. It does not.
That last point matters. A topographic map is excellent at showing the structure of the ground, but it cannot show every temporary condition. A stream may be swollen after rain, a slope may be greasy underfoot, and a track that looks neat on paper may have become a mess after a wet week. I always pair the map with current conditions and recent route information before I commit to a plan.
Once you accept that limitation, the map becomes more reliable, not less, because you stop expecting it to do a job it was never meant to do. The final step is learning a simple habit that keeps all of this working in the field.
The habit that makes the map useful on the hill
The best map-reading habit is also the simplest: keep checking where the contour pattern says you should be. I do not wait until I am lost or at a junction. I look at the map whenever the terrain changes, whenever a valley opens out, and whenever the slope starts to feel different from what I expected.
- Orient the map to the ground so north, ridges, and valleys make visual sense.
- Find two obvious features, such as a stream and a ridge, to confirm position.
- Look ahead one contour band, not just one path junction.
- Use the next obvious landform, like a spur or valley, as a checkpoint.
- Recheck the grid reference whenever visibility drops or the route becomes less obvious.
That approach sounds unglamorous, but it works. It keeps small mistakes from turning into long detours and makes the whole landscape easier to read. When I use a topographic map well, I am not just finding a route. I am understanding the ground well enough to make better decisions on it.